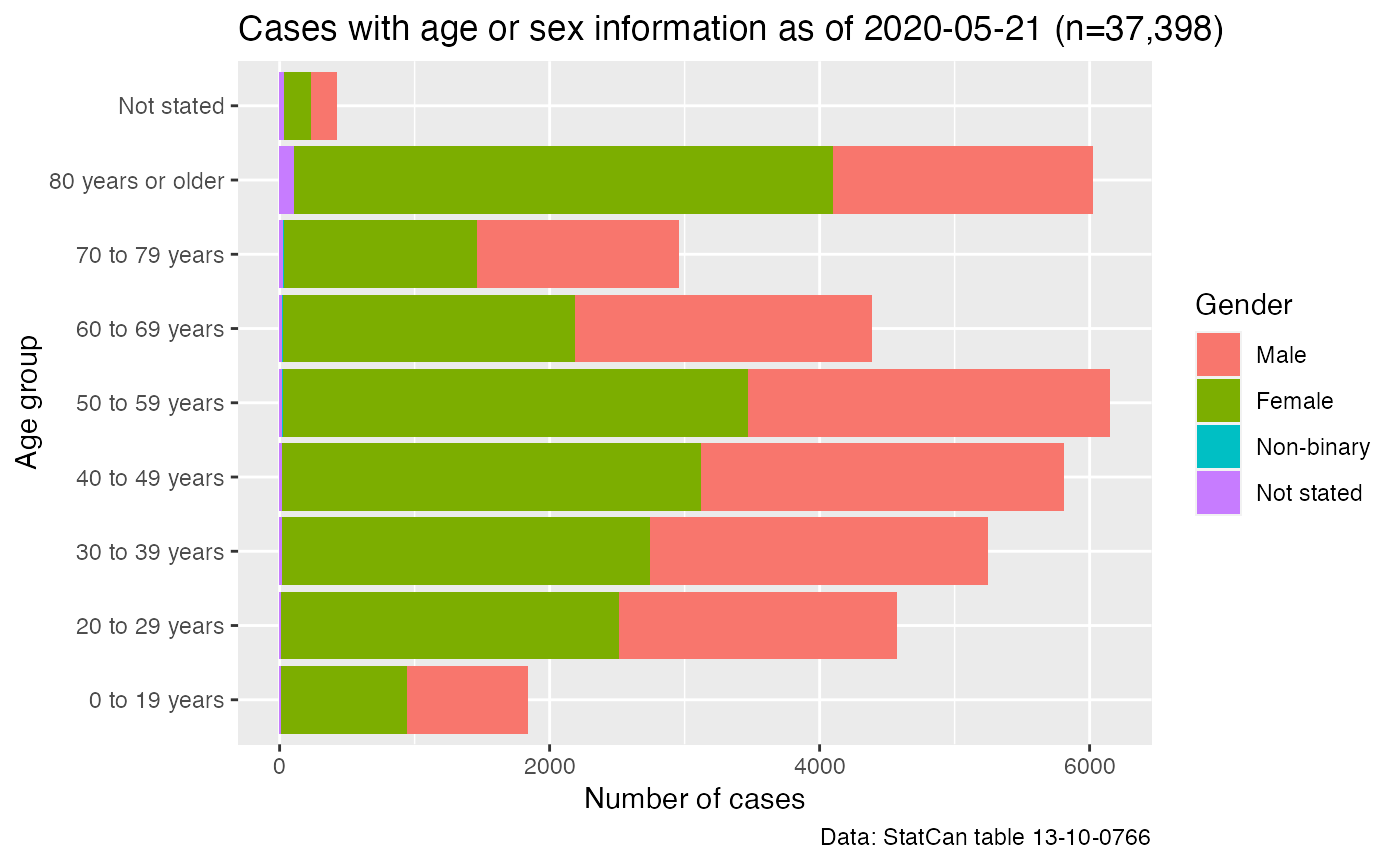
case_data <- get_cansim_case_data()

ggplot(case_data,aes(x=`Age group`,fill=Gender)) +
  geom_bar() +
  labs(title=paste0("Cases with age or sex information as of ",
                    max(case_data$Date2), " (n=",scales::comma(nrow(case_data)),")"),
       y="Number of cases",
       caption="Data: StatCan table 13-10-0766") +
  coord_flip()