Data discovery
Resources for finding available and relevant data
Source:vignettes/data_discovery.Rmd
data_discovery.RmdCensus datasets
cancensus can access Statistics Canada Census data for
the 1996, 2001, 2006 Censuses, the 2011 Census and National Household
Survey, the 2016 Census, as well as the 2021 Census. You can run
list_census_datasets to check what datasets are currently
available for access through the CensusMapper API.
Thanks to contributions by the Canada Mortgage and Housing
Corporation (CMHC), cancensus now includes additional
Census-linked datasets as open-data releases. These include annual
tax-filer data at the census tract level for tax years 2000 through
2017, which includes data on incomes and demographics, as well as
specialized crosstabs for Structural type of dwelling by Document type,
which details occupancy status for residences. These crosstabs are
available for the 2001, 2006, 2011, and 2016 Census years at all levels
starting with census tract.
list_census_datasets()
#> # A tibble: 29 × 6
#>    dataset description           attribution reference reference_url geo_dataset
#>    <chr>   <chr>                 <chr>       <chr>     <chr>         <chr>
#>  1 CA1996  1996 Canada Census    StatCan 19… 92-351-U  https://www1… CA1996
#>  2 CA01    2001 Canada Census    StatCan 20… 92-378-X  https://www1… CA01
#>  3 CA06    2006 Canada Census    StatCan 20… 92-566-X  https://www1… CA06
#>  4 CA11    2011 Canada Census a… StatCan 20… 98-301-X… https://www1… CA11
#>  5 CA16    2016 Canada Census    StatCan 20… 98-301-X  https://www1… CA16
#>  6 CA21    2021 Canada Census    StatCan 20… 98-301-X  https://www1… CA21
#>  7 CA01xSD 2001 Canada Census x… StatCan 20… 92-378-X  https://www1… CA01
#>  8 CA06xSD 2006 Canada Census x… StatCan 20… 92-566-X  https://www1… CA06
#>  9 CA11xSD 2011 Canada Census x… StatCan 20… 98-301-X  https://www1… CA11
#> 10 CA16xSD 2016 Canada Census x… StatCan 20… 98-301-X  https://www1… CA16
#> # ℹ 19 more rows
The list_census_datasets() function also provides
additional background like series reference code, catalogue reference,
and attribution details.
Variable vectors
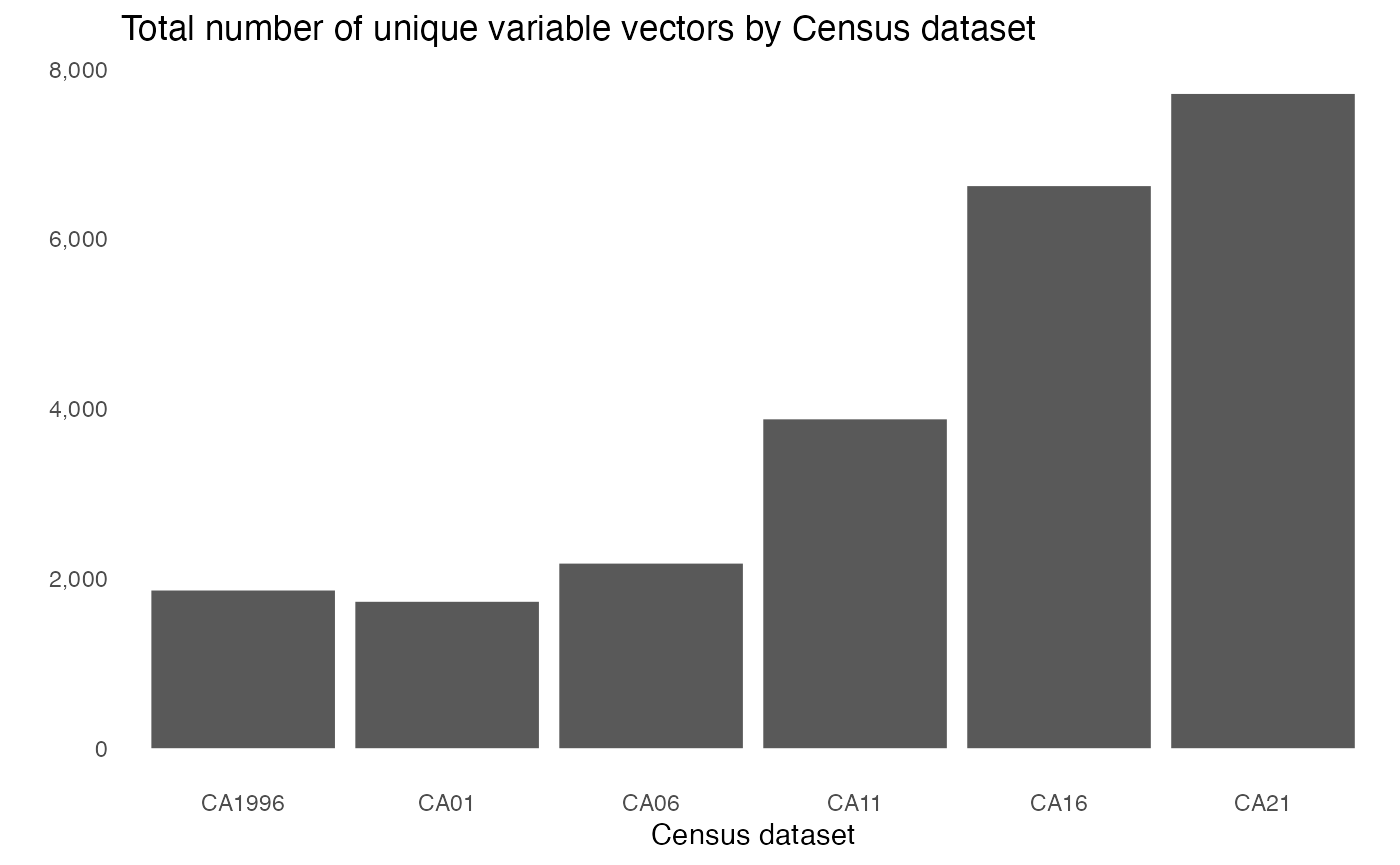
The Census datasets that the cancensus package provides
access to are rich in detail but they can be complex to navigate. There
are thousands of variable vectors, including separate vector indicators
for aggregations split by Total, Female, and
Male populations. As a result, the total number of vectors
per dataset is significant, ranging from 1,715 in the CA01
dataset to 6,623 in the CA16 one.
View available Census variable vectors
list_census_vectors('CA21')
#> # A tibble: 7,709 × 7
#>    vector    type   label                units parent_vector aggregation details
#>    <chr>     <fct>  <chr>                <fct> <chr>         <chr>       <chr>
#>  1 v_CA21_1  Total  Population, 2021     Numb… NA            Additive    CA 202…
#>  2 v_CA21_2  Total  Population, 2016     Numb… NA            Additive    CA 202…
#>  3 v_CA21_3  Total  Population percenta… Numb… NA            Average of… CA 202…
#>  4 v_CA21_4  Total  Total private dwell… Numb… NA            Additive    CA 202…
#>  5 v_CA21_5  Total  Private dwellings o… Numb… v_CA21_4      Additive    CA 202…
#>  6 v_CA21_6  Total  Population density … Ratio NA            Average of… CA 202…
#>  7 v_CA21_7  Total  Land area in square… Numb… NA            Additive    CA 202…
#>  8 v_CA21_8  Total  Total - Age          Numb… NA            Additive    CA 202…
#>  9 v_CA21_9  Male   Total - Age          Numb… NA            Additive    CA 202…
#> 10 v_CA21_10 Female Total - Age          Numb… NA            Additive    CA 202…
#> # ℹ 7,699 more rows
list_census_vectors(dataset) retrieves an index of all
available vectors for a given dataset from the CensusMapper API or local
cache if recently called. Each Census variable has a vector code
assigned to it with naming pattern that goes
v_{dataset}_{index}. This is the code by which vectors are
identified through the CensusMapper API. In addition the vector code,
there is additional information showing population type, aggregation
type, label and details, as well as variable hierarchy. This function
can also be used to show the variables for additional datasets made
accessible through the CensusMapper API.
Searching for Census variable vectors
Due to the large number of Census variables it can be hard to find
the right data. There is a function for searching through Census
variable metadata in a few different ways. There are three types of
searches possible using this function: exact search, which simply looks
for exact string matches for a given query against the vector dataset;
keyword search, which breaks vector metadata into unigram tokens and
then tries to find the vectors with the greatest number of unique
matches; and, semantic search which works better with search phrases and
has tolerance for inexact searches. Switching between search modes is
done using the query_type argument when calling
find_census_vectors() function.
Note that variable search is optimized for the Census variables in the main Census datasets. While searches generally work for variables in additional datasets such as cross-tabs and taxfiler data, they have not been extensively tested against these datasets.
Exact search
Exact search uses exact string matching. It is best used when you know exactly the term you are looking for, and is not robust to spelling errors.
find_census_vectors("Oji-cree", dataset = "CA16", type = "total", query_type = "exact")
#> # A tibble: 4 × 4
#>   vector      type  label    details
#>   <chr>       <fct> <chr>    <chr>
#> 1 v_CA16_626  Total Oji-Cree Language; Total - Mother tongue for the total popu…
#> 2 v_CA16_1433 Total Oji-Cree Language; Total - Language spoken most often at ho…
#> 3 v_CA16_2676 Total Oji-Cree 25% Data; Total - Knowledge of languages for the p…
#> 4 v_CA16_5930 Total Oji-Cree 25% Data; Work; Total - Language used most often a…
This, on the other hand, will return a warning.
find_census_vectors("Ojib-cree", dataset = "CA16", type = "total", query_type = "exact")
#> Warning: No exact matches found. Please check spelling and try again or consider using semantic or keyword search.
#> See ?find_census_vectors() for more details.
#>
#> Alternatively, you can launch the Censusmapper web API in a browser by calling explore_census_vectors(dataset)
Unless otherwise specified, find_census_vectors() will
use exact search as the default option.
Keyword search
Keyword search is meant to be used when you know the approximate subject matter of the variable without knowing the exact variable you are looking for. Under the hood, keyword search splits the query and vector details into unique unigram tokens and then looks for the vectors with the greatest number of matches.
find_census_vectors('commute mode', dataset = 'CA16', type = 'female', query_type = 'keyword', interactive = FALSE)
#> # A tibble: 7 × 4
#>   vector      type   label                                               details
#>   <chr>       <fct>  <chr>                                               <chr>
#> 1 v_CA16_5794 Female Total - Main mode of commuting for the employed la… 25% Da…
#> 2 v_CA16_5797 Female Car, truck, van - as a driver                       25% Da…
#> 3 v_CA16_5800 Female Car, truck, van - as a passenger                    25% Da…
#> 4 v_CA16_5803 Female Public transit                                      25% Da…
#> 5 v_CA16_5806 Female Walked                                              25% Da…
#> 6 v_CA16_5809 Female Bicycle                                             25% Da…
#> 7 v_CA16_5812 Female Other method                                        25% Da…
Keyword search will show all results that have the highest number of
unique keyword matches. What happens if there are other keyword matches
that have fewer total matches? By default, the function argument is set
as interactive = TRUE, which will prompt the user with a
console menu option to see the rest of the matches or not. If using
find_census_vectors() in a script or reproducible
documentation, we recommend setting this argument to
interactive = FALSE.
Semantic search
Semantic search works best with phrases. Rather than the decontextualized unigrams of keyword search, semantic search splits queries and vector details into n-grams and finds matches using approximate string distances based on the generalized Levenshtein distance.
find_census_vectors("after tax incomes", dataset = "CA16", type = "total", query_type = "semantic")
#> # A tibble: 243 × 4
#>    vector      type  label                                               details
#>    <chr>       <fct> <chr>                                               <chr>
#>  1 v_CA16_454  Total Married or living common law                        Census…
#>  2 v_CA16_457  Total Married                                             Census…
#>  3 v_CA16_460  Total Living common law                                   Census…
#>  4 v_CA16_463  Total Not married and not living common law               Census…
#>  5 v_CA16_466  Total Never married                                       Census…
#>  6 v_CA16_469  Total Separated                                           Census…
#>  7 v_CA16_472  Total Divorced                                            Census…
#>  8 v_CA16_475  Total Widowed                                             Census…
#>  9 v_CA16_487  Total Common-law couples                                  Census…
#> 10 v_CA16_2201 Total Total - Income statistics in 2015 for the populati… Income…
#> # ℹ 233 more rows
Semantic search is more robust to spelling and punctuation issues that may come up with exact search. For example, while this throws a warning:
find_census_vectors("ojib cree", dataset = "CA16", type = "total", query_type = "exact")
#> Warning: No exact matches found. Please check spelling and try again or consider using semantic or keyword search.
#> See ?find_census_vectors() for more details.
#>
#> Alternatively, you can launch the Censusmapper web API in a browser by calling explore_census_vectors(dataset)
This will find the correct Census vector.
find_census_vectors('ojib cree', dataset = 'CA16', type = 'total', query_type = 'semantic')
#> Multiple possible matches. Results ordered by closeness.
#> # A tibble: 57 × 4
#>    vector     type  label                     details
#>    <chr>      <fct> <chr>                     <chr>
#>  1 v_CA16_575 Total Cree-Montagnais languages Language; Total - Mother tongue f…
#>  2 v_CA16_578 Total Atikamekw                 Language; Total - Mother tongue f…
#>  3 v_CA16_581 Total Montagnais (Innu)         Language; Total - Mother tongue f…
#>  4 v_CA16_584 Total Moose Cree                Language; Total - Mother tongue f…
#>  5 v_CA16_587 Total Naskapi                   Language; Total - Mother tongue f…
#>  6 v_CA16_590 Total Northern East Cree        Language; Total - Mother tongue f…
#>  7 v_CA16_593 Total Plains Cree               Language; Total - Mother tongue f…
#>  8 v_CA16_596 Total Southern East Cree        Language; Total - Mother tongue f…
#>  9 v_CA16_599 Total Swampy Cree               Language; Total - Mother tongue f…
#> 10 v_CA16_602 Total Woods Cree                Language; Total - Mother tongue f…
#> # ℹ 47 more rows
Results are ordered by string proximity if there are multiple possible matches.
Census regions
Standard Geographical Classification
Statistics Canada uses an official classification of geographic areas
known as the Standard
Geographical Classification (SGC), which is updated periodically.
The latest version is based on the 2021 Census. Geographic
classification codes are standardized across Statistics Canada products,
including the Census as well as any other Statistics Canada dataset. In
practice, this means that the region ID for the Vancouver Census
subdivision is 5915022 across all products. In cancensus
the region ID code is used to identify the appropriate spatial vector
data to retrieve alongside Census data. These region IDs have a
predictable structure, where provinces are two digits, Census divisions
are 4 digits (including 2 for the province), and Census subdivisions
have 7 digits (including 2 for the province, and 2 for the Census
division).
#> # A tibble: 3 × 4
#>      PR    CD   CSD name
#>   <dbl> <dbl> <dbl> <chr>
#> 1    35    NA    NA Ontario
#> 2    35    18    NA Durham (Regional municipality
#> 3    35    18    13 Oshawa (City)
These levels are hierarchical and complete in that a province is split in Census divisions, which are then split into Census subdivisions.
Geographies have standardized names for the province, Census division, and Census subdivision levels, as well as Census metropolitan areas and Census agglomerations. Lower geographic levels such as Census tracts or dissemination areas (DA, EA, and DB) are not named or listed but have unique identifying codes derived from their parent Census subdivision.
#> # A tibble: 6 × 2
#>   level     n
#>   <chr> <int>
#> 1 C         1
#> 2 CA        9
#> 3 CD      293
#> 4 CMA      41
#> 5 CSD    5161
#> 6 PR       13
There is also an additional region, with the id 01 and
the level code C which represents all of Canada as a
whole.
A note on Census Metropolitan Areas and Census Agglomerations
Data can also be extracted at the Census Metropolitan Area (CMA) or Census Agglomeration (CA) level, which is derived from a variant of the SGC known as the Statistical Area Classification. Hierarchically, CMAs and CAs represent a collection of constituent Census subdivisions.
A Census metropolitan area consists of adjacent municipalities with a defined core with a total population of at least 100,000 of which 50,000 or more must live in the core based on Census data. Adjacent municipalities must have a high degree of integration with the core, which Statistics Canada measures based on the commuting flows indicated in Census data. Census Agglomeration areas have to have a core population above 10,000.
All CMAs and CAs consist of Census subdivisions but not all Census subdivisions are a subset of a CMA or a CA. For more details on CMAs and CAs, consult Statistics Canada’s Census Dictionary article for Census metropolitan areas (CMA) and census agglomerations (CA). All CMAs and some CAs have data at the Census tract level, but most CAs do not. The 2021 Census has 41 CMAs and 9 CAs with Census tracts that have their own defined geography. There are a further 102 CAs without Census tracts that do not have their own distinctly defined geographies.
Aside: dissemination areas, blocks, and enumeration areas
Dissemination areas (DA) are the smallest atomic geographic unit at which all census data is captured. DAs cover the entirety of Canada and follow the boundaries of census subdivisions and census tracts. While inter-census geographic stability is not guaranteed, they generally tend to be as stable as the census tracts and census subdivisions that they make up. In addition to census boundaries, DAs will generally follow natural boundaries created by other spatial features like roads, railways, water features, and designed to be spatially compact and with a target population around 400-700 persons. The 2021 census data has 57,936 distinct DAs.
Enumeration areas (EA) were the DA equivalent for censuses prior to 2001. Similar to DAs, EAs were used to as the basic level at which census data was collected. They do not necessarily correspond accurately to DAs in data from 2001 onwards.
Dissemination block (DB) level data is available for the 2001-2021 datasets. DBs are essentially city blocks, bounded by intersecting streets and therefore are largely the product of road networks at the time of the census. The geographies and identification codes of DBs are not necessarily stable over time. DBs are split whenever they intersect with boundaries of higher geographic levels in such a way as to ensure that they can be aggregated upwards precisely. DBs only provide data for population, dwelling counts, and number of households (from 2006 onwards) without any additional characteristic data. DBs with population under 15 have their population counts adjusted for privacy. For the 2021 census, there are close to half a million DB distinct regions.
Viewing available Census regions
For any valid Census dataset, you can view all available Census
regions by calling list_census_regions(dataset). This will
retrieve the region code, the name, and the
level code indicating the type of geography. Other
information includes population, municipal status, as well as parent
geographic ids for lower levels. All CMAs are included with their own
defined geography, as well as those CAs which have their own Census
tracts.
list_census_regions('CA21')
#> # A tibble: 5,518 × 8
#>    region name               level    pop municipal_status CMA_UID CD_UID PR_UID
#>    <chr>  <chr>              <chr>  <int> <chr>            <chr>   <chr>  <chr>
#>  1 01     Canada             C     3.70e7 NA               NA      NA     NA
#>  2 35     Ontario            PR    1.42e7 Ont.             NA      NA     NA
#>  3 24     Quebec             PR    8.50e6 Que.             NA      NA     NA
#>  4 59     British Columbia   PR    5.00e6 B.C.             NA      NA     NA
#>  5 48     Alberta            PR    4.26e6 Alta.            NA      NA     NA
#>  6 46     Manitoba           PR    1.34e6 Man.             NA      NA     NA
#>  7 47     Saskatchewan       PR    1.13e6 Sask.            NA      NA     NA
#>  8 12     Nova Scotia        PR    9.69e5 N.S.             NA      NA     NA
#>  9 13     New Brunswick      PR    7.76e5 N.B.             NA      NA     NA
#> 10 10     Newfoundland and … PR    5.11e5 N.L.             NA      NA     NA
#> # ℹ 5,508 more rowsSearching through named Census regions
We can also search through all named geographies. This will return any geographies that have a name that matches or partially matches the search query.
search_census_regions("Vancouver","CA21")
#> # A tibble: 7 × 8
#>   region  name              level     pop municipal_status CMA_UID CD_UID PR_UID
#>   <chr>   <chr>             <chr>   <int> <chr>            <chr>   <chr>  <chr>
#> 1 59933   Vancouver         CMA   2642825 B                NA      NA     59
#> 2 5915    Greater Vancouver CD    2642825 RD               NA      NA     59
#> 3 5915022 Vancouver         CSD    662248 CY               59933   5915   59
#> 4 5915046 North Vancouver   CSD     88168 DM               59933   5915   59
#> 5 5915051 North Vancouver   CSD     58120 CY               59933   5915   59
#> 6 5915055 West Vancouver    CSD     44122 DM               59933   5915   59
#> 7 5915020 Metro Vancouver A CSD     18612 RDA              59933   5915   59
Exploring Census variable vectors and regions interactively
Sometimes it can be easier to find the right vectors or regions by exploring the layout and hierarchy of Census data. This is especially true when we are not sure of what information is available or are not sure where to start. Finding the right Census geographic code on a map will be easier for some than using named search. This is also handy if we want to assemble a custom aggregation of region codes at different hierarchies.
To facilitate this, we have included a couple of convenience
functions that take you directly to an interactive tool with variable
and region details on the Censusmapper website. To explore
the hierarchical variable structure of a given dataset, say the 2006
Census, running explore_census_vectors(dataset = "CA06").
To view Census geography on an interactive map, there is
explore_census_regions(dataset = "CA16"). As usual, vectors
and geographies for different Census datasets can be retrieved by using
the appropriate dataset code for the dataset argument.